News
Datadog’s Toto: Open-Source Observability Model
Datadog unveils Toto, a 151M-parameter time-series foundation model and BOOM benchmark, sparking a new open-source, AI-driven observability wave.
News
Datadog unveils Toto, a 151M-parameter time-series foundation model and BOOM benchmark, sparking a new open-source, AI-driven observability wave.
Best Practices
Observability is crucial for LLM apps to ensure performance, reliability, and user trust. It involves monitoring metrics, logging prompts, outputs, and user interactions.
Thought Leadership
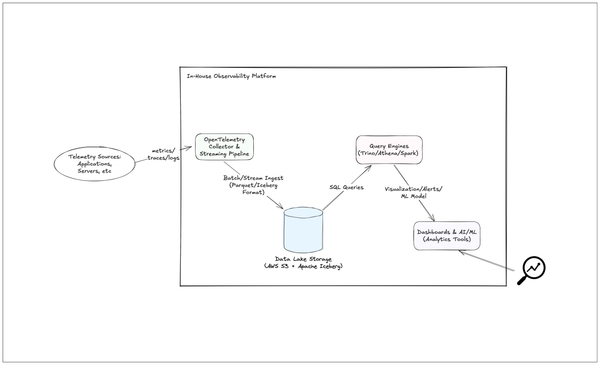
In-house observability with data lake: unify metrics, logs & traces on AWS S3 + Iceberg to slash cost, dodge vendor lock-in & boost analytics.
Thought Leadership
In Part 3, we explored building scalable telemetry pipelines with agents, batching, Kafka buffering, and backpressure control for resilient observability. Now let's bring it home with this last part of our blog series by addressing how to make the entire pipeline horizontally scalable and highly available, explore cost
Thought Leadership
In Part 2, we saw that scaling observability pipelines involves specialized strategies for each telemetry signal type. For metrics, scalable architectures use distributed storage, aggregation, downsampling, etc. to handle high volumes. Traces pipelines employ sampling strategies like head-based, tail-based, and remote sampling to manage trace volume. While for Logs, it
News
In a significant shake-up within the observability space, Israeli startup Groundcover recently announced a $35 million Series B funding round, led by Zeev Ventures, bringing their total funding to $60 million. This latest funding underscores the industry's strong appetite for modern, streamlined observability solutions designed for cloud-native ecosystems.
Thought Leadership
In the Part 1, we saw that a scalable pipeline architecture consists of data collection, processing, storage, and querying stages, with key design principles including horizontal scaling, stateless processing, and backpressure management. Now, let's examine specialized scaling strategies for each telemetry signal type. Scaling Observability: Designing a High-Volume
Thought Leadership
Building observability in large-scale, cloud-native systems requires collecting telemetry data (metrics, traces, and logs) at extremely high volumes. Modern platforms like Kubernetes can generate millions of metrics, traces, and log events per second, and enterprises often must handle this flood of telemetry across hybrid environments (on-premises and cloud). Designing a
How To
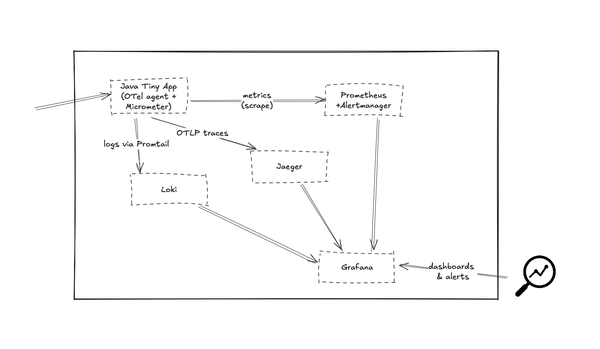
Goal: Spin up Prometheus+Alertmanager, Loki+Promtail, Jaeger, and Grafana with a single docker‑compose.yml, then watch a tiny Java HTTP service emit metrics, logs, and traces—all in less than an hour. Why this post? You keep hearing that “observability ≠ monitoring” and that you need metrics, logs, and
Tooling Deep-Dives
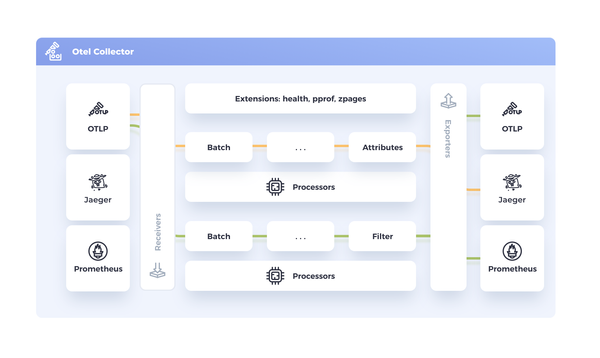
OpenTelemetry’s Collector is a vendor-neutral service that sits between your applications and observability backends. It can receive telemetry data (traces, metrics, logs), process or transform it, and export it to one or multiple destinations. In a production environment, the Collector becomes essential for building a flexible and resilient observability
OpenTelemetry Corner
OpenTelemetry (OTel) has quickly become a cornerstone of modern observability. If you’re a developer or engineer looking to instrument your applications for better insight, this beginner’s guide is for you. I’ll explain what OpenTelemetry is, why it matters, and walk through a step-by-step tutorial to instrument a
Fundamentals
Welcome to the world of observability! If you’re new to this field, all the jargon and acronyms can feel overwhelming. But fear not—this beginner’s cheat sheet will walk you through the essential observability terms in plain language. Use it as a reference whenever you encounter an unfamiliar