Building Your First Observability Stack with Open‑Source Tools
Goal: Spin up Prometheus+Alertmanager, Loki+Promtail, Jaeger, and Grafana with a single docker‑compose.yml, then watch a tiny Java HTTP service emit metrics, logs, and traces—all in less than an hour.
Why this post?
You keep hearing that “observability ≠ monitoring” and that you need metrics, logs, and traces working together. But SaaS bills and steep learning curves can be buzz‑kills. This guide is a hands‑on shortcut: everything runs locally in Docker, so you can poke around, break things, and learn risk‑free.
Prerequisites
Docker & docker‑compose installed
Basic
docker compose up/docker compose downfamiliarityJDK 21+ and Maven
1 – Scaffold a Tiny Java Service
Create a folder tiny-app/
mkdir tiny-app && cd tiny-app
1.1 pom.xml
| <?xml version="1.0" encoding="UTF-8"?> | |
| <project xmlns="http://maven.apache.org/POM/4.0.0" | |
| xmlns:xsi="http://www.w3.org/2001/XMLSchema-instance" | |
| xsi:schemaLocation="http://maven.apache.org/POM/4.0.0 http://maven.apache.org/xsd/maven-4.0.0.xsd"> | |
| <modelVersion>4.0.0</modelVersion> | |
| <groupId>how.observability</groupId> | |
| <artifactId>tiny-app</artifactId> | |
| <version>1.0-SNAPSHOT</version> | |
| <properties> | |
| <maven.compiler.source>21</maven.compiler.source> | |
| <maven.compiler.target>21</maven.compiler.target> | |
| <project.build.sourceEncoding>UTF-8</project.build.sourceEncoding> | |
| <micrometer.version>1.14.6</micrometer.version> | |
| <javalin.version>6.6.0</javalin.version> | |
| <slf4j-simple.version>2.0.17</slf4j-simple.version> | |
| <maven-shade-plugin.version>3.6.0</maven-shade-plugin.version> | |
| </properties> | |
| <dependencies> | |
| <!-- Minimal embedded HTTP server --> | |
| <dependency> | |
| <groupId>io.javalin</groupId> | |
| <artifactId>javalin</artifactId> | |
| <version>${javalin.version}</version> | |
| </dependency> | |
| <!-- Micrometer core + Prometheus registry --> | |
| <dependency> | |
| <groupId>io.micrometer</groupId> | |
| <artifactId>micrometer-core</artifactId> | |
| <version>${micrometer.version}</version> | |
| </dependency> | |
| <dependency> | |
| <groupId>io.micrometer</groupId> | |
| <artifactId>micrometer-registry-prometheus</artifactId> | |
| <version>${micrometer.version}</version> | |
| </dependency> | |
| <!-- SLF4J for logs --> | |
| <dependency> | |
| <groupId>org.slf4j</groupId> | |
| <artifactId>slf4j-simple</artifactId> | |
| <version>${slf4j-simple.version}</version> | |
| </dependency> | |
| </dependencies> | |
| <build> | |
| <plugins> | |
| <plugin> | |
| <groupId>org.apache.maven.plugins</groupId> | |
| <artifactId>maven-shade-plugin</artifactId> | |
| <version>${maven-shade-plugin.version}</version> | |
| <executions> | |
| <execution> | |
| <phase>package</phase> | |
| <goals> | |
| <goal>shade</goal> | |
| </goals> | |
| <configuration> | |
| <transformers> | |
| <transformer implementation="org.apache.maven.plugins.shade.resource.ManifestResourceTransformer"> | |
| <mainClass>how.observability.TinyApp</mainClass> | |
| </transformer> | |
| </transformers> | |
| </configuration> | |
| </execution> | |
| </executions> | |
| </plugin> | |
| </plugins> | |
| </build> | |
| </project> |
1.2 TinyApp.java
| package how.observability; | |
| import io.javalin.Javalin; | |
| import io.micrometer.core.instrument.Counter; | |
| import io.micrometer.core.instrument.Metrics; | |
| import io.micrometer.prometheusmetrics.PrometheusConfig; | |
| import io.micrometer.prometheusmetrics.PrometheusMeterRegistry; | |
| import org.slf4j.Logger; | |
| import org.slf4j.LoggerFactory; | |
| public class TinyApp { | |
| public static void main(String[] args) { | |
| Logger log = LoggerFactory.getLogger(TinyApp.class); | |
| PrometheusMeterRegistry prometheus = new PrometheusMeterRegistry(PrometheusConfig.DEFAULT); | |
| Metrics.addRegistry(prometheus); | |
| Counter hits = Counter.builder("tiny_hits_total") | |
| .description("Total hello hits") | |
| .register(prometheus); | |
| Javalin app = Javalin.create() | |
| .get("/hello", ctx -> { | |
| hits.increment(); | |
| log.info("Handled /hello for {}", ctx.ip()); | |
| ctx.result("Hello " + ctx.ip()); | |
| }) | |
| .get("/metrics", ctx -> ctx.result(prometheus.scrape())) | |
| .start(8080); | |
| log.info("Tiny app started at http://localhost:8080"); | |
| } | |
| } |
1.3 Dockerfile
| FROM maven:3.9.9-eclipse-temurin-21 AS build | |
| WORKDIR /build | |
| COPY pom.xml . | |
| RUN mvn -q dependency:go-offline | |
| COPY src ./src | |
| RUN mvn -q package -DskipTests | |
| FROM eclipse-temurin:21-jre | |
| WORKDIR /app | |
| COPY --from=build /build/target/tiny-app-1.0-SNAPSHOT.jar app.jar | |
| # Grab the OpenTelemetry Java agent | |
| ADD https://github.com/open-telemetry/opentelemetry-java-instrumentation/releases/download/v2.15.0/opentelemetry-javaagent.jar /otel.jar | |
| ENV OTEL_SERVICE_NAME=tiny-app | |
| ENV OTEL_TRACES_EXPORTER=otlp | |
| ENV OTEL_EXPORTER_OTLP_ENDPOINT=http://jaeger:4318 | |
| ENV OTEL_METRICS_EXPORTER=none | |
| ENV OTEL_LOGS_EXPORTER=none | |
| EXPOSE 8080 | |
| ENTRYPOINT ["java","-javaagent:/otel.jar","-jar","app.jar"] |
Build it:
docker build -t tiny-app:latest .2 – Prometheus (+ Alertmanager) Config
2.1 prometheus.yaml
| global: | |
| scrape_interval: 15s | |
| scrape_configs: | |
| - job_name: 'tiny-app' | |
| metrics_path: /metrics | |
| static_configs: | |
| - targets: ['tiny-app:8080'] | |
| alerting: | |
| alertmanagers: | |
| - static_configs: | |
| - targets: ['alertmanager:9093'] | |
| rule_files: | |
| - alert_rules.yaml |
2.2 alert-rules.yaml
| groups: | |
| - name: tiny.rules | |
| rules: | |
| - alert: HighRequestRate | |
| expr: rate(tiny_hits_total[1m]) > 5 | |
| for: 1m | |
| labels: | |
| severity: warning | |
| annotations: | |
| summary: "High request rate on tiny-app" | |
| description: "Request rate >5 RPS for 1 min." |
2.3 alertmanager.yaml
We’ll use a throw‑away “alert‑logger” container that simply prints POST bodies to stdout so you can observe alerts without email/SMS.
| route: | |
| receiver: 'log' | |
| receivers: | |
| - name: 'log' | |
| webhook_configs: | |
| - url: 'http://alert-logger:5678' |
3 – Loki & Promtail Config
3.1 loki.yaml
| auth_enabled: false | |
| server: | |
| http_listen_port: 3100 | |
| grpc_listen_port: 9096 | |
| log_level: debug | |
| grpc_server_max_concurrent_streams: 1000 | |
| common: | |
| instance_addr: 127.0.0.1 | |
| path_prefix: /tmp/loki | |
| storage: | |
| filesystem: | |
| chunks_directory: /tmp/loki/chunks | |
| rules_directory: /tmp/loki/rules | |
| replication_factor: 1 | |
| ring: | |
| kvstore: | |
| store: inmemory | |
| query_range: | |
| results_cache: | |
| cache: | |
| embedded_cache: | |
| enabled: true | |
| max_size_mb: 100 | |
| limits_config: | |
| metric_aggregation_enabled: true | |
| schema_config: | |
| configs: | |
| - from: 2020-10-24 | |
| store: tsdb | |
| object_store: filesystem | |
| schema: v13 | |
| index: | |
| prefix: index_ | |
| period: 24h | |
| pattern_ingester: | |
| enabled: true | |
| metric_aggregation: | |
| loki_address: localhost:3100 | |
| ruler: | |
| alertmanager_url: http://alertmanager:9093 | |
| frontend: | |
| encoding: protobuf | |
| analytics: | |
| reporting_enabled: false |
3.2 promtail.yaml
| server: | |
| http_listen_port: 9080 | |
| grpc_listen_port: 0 | |
| positions: | |
| filename: /tmp/positions.yaml | |
| clients: | |
| - url: http://loki:3100/loki/api/v1/push | |
| scrape_configs: | |
| - job_name: container_logs | |
| docker_sd_configs: | |
| - host: unix:///var/run/docker.sock | |
| refresh_interval: 5s | |
| relabel_configs: | |
| - source_labels: [ '__meta_docker_container_name' ] | |
| regex: '/(.*)' | |
| target_label: 'container' |
4 – Docker Compose Config
| services: | |
| # -------------- Observability back‑end stack -------------- | |
| prometheus: | |
| image: prom/prometheus:v3.3.0 | |
| volumes: | |
| - ./prometheus.yaml:/etc/prometheus/prometheus.yaml | |
| - ./alert-rules.yaml:/etc/prometheus/alert_rules.yaml | |
| ports: | |
| - "9090:9090" | |
| command: | |
| - "--config.file=/etc/prometheus/prometheus.yaml" | |
| alertmanager: | |
| image: prom/alertmanager:v0.28.1 | |
| volumes: | |
| - ./alertmanager.yaml:/etc/alertmanager/alertmanager.yml | |
| ports: | |
| - "9093:9093" | |
| loki: | |
| image: grafana/loki:3.5.0 | |
| ports: | |
| - "3100:3100" | |
| volumes: | |
| - ./loki.yaml:/etc/loki/local-config.yaml | |
| command: -config.file=/etc/loki/local-config.yaml | |
| promtail: | |
| image: grafana/promtail:3.5.0 | |
| volumes: | |
| - /var/run/docker.sock:/var/run/docker.sock | |
| - ./promtail.yaml:/etc/promtail/config.yaml | |
| - /var/lib/docker/containers:/var/log/containers:ro | |
| command: -config.file=/etc/promtail/config.yaml | |
| jaeger: | |
| image: jaegertracing/all-in-one:1.68.0 | |
| environment: | |
| COLLECTOR_OTLP_ENABLED: "true" | |
| ports: | |
| - "16686:16686" # UI | |
| - "4318:4318" # OTLP HTTP | |
| grafana: | |
| image: grafana/grafana:11.6.1 | |
| depends_on: [prometheus, loki, jaeger] | |
| ports: | |
| - "3000:3000" | |
| environment: | |
| GF_SECURITY_ADMIN_PASSWORD: "admin" | |
| volumes: | |
| - grafana-data:/var/lib/grafana | |
| # -------------- Tiny application -------------- | |
| tiny-app: | |
| image: tiny-app:latest | |
| build: | |
| context: ./tiny-app | |
| depends_on: [jaeger] | |
| ports: | |
| - "8080:8080" | |
| labels: | |
| logging: "promtail" | |
| # -------------- Alert sink for Tiny stack -------------- | |
| alert-logger: | |
| image: mendhak/http-https-echo:36 | |
| environment: | |
| HTTP_PORT: 5678 | |
| ports: | |
| - "5678:5678" | |
| volumes: | |
| grafana-data: {} |
5 – Fire It Up!
docker compose up -dGive it ~30 seconds. Hit the demo app:
curl http://localhost:8080/hello
ab -n 200 -c 20 http://localhost:8080/hello   # generate some load
You should see “Hello” responses and, in the container logs, Handled /hello … log lines (Promtail picks them up).
6 – Exploring the Data
6.1 Grafana Login
Browser →
http://localhost:3000
User:adminPassword:admin
Hit Connections → Data Sources → Add new data source and select each
Prometheus url → http://prometheus:9090
Loki url → http://loki:3100
Jaeger url → http://jaeger:16686
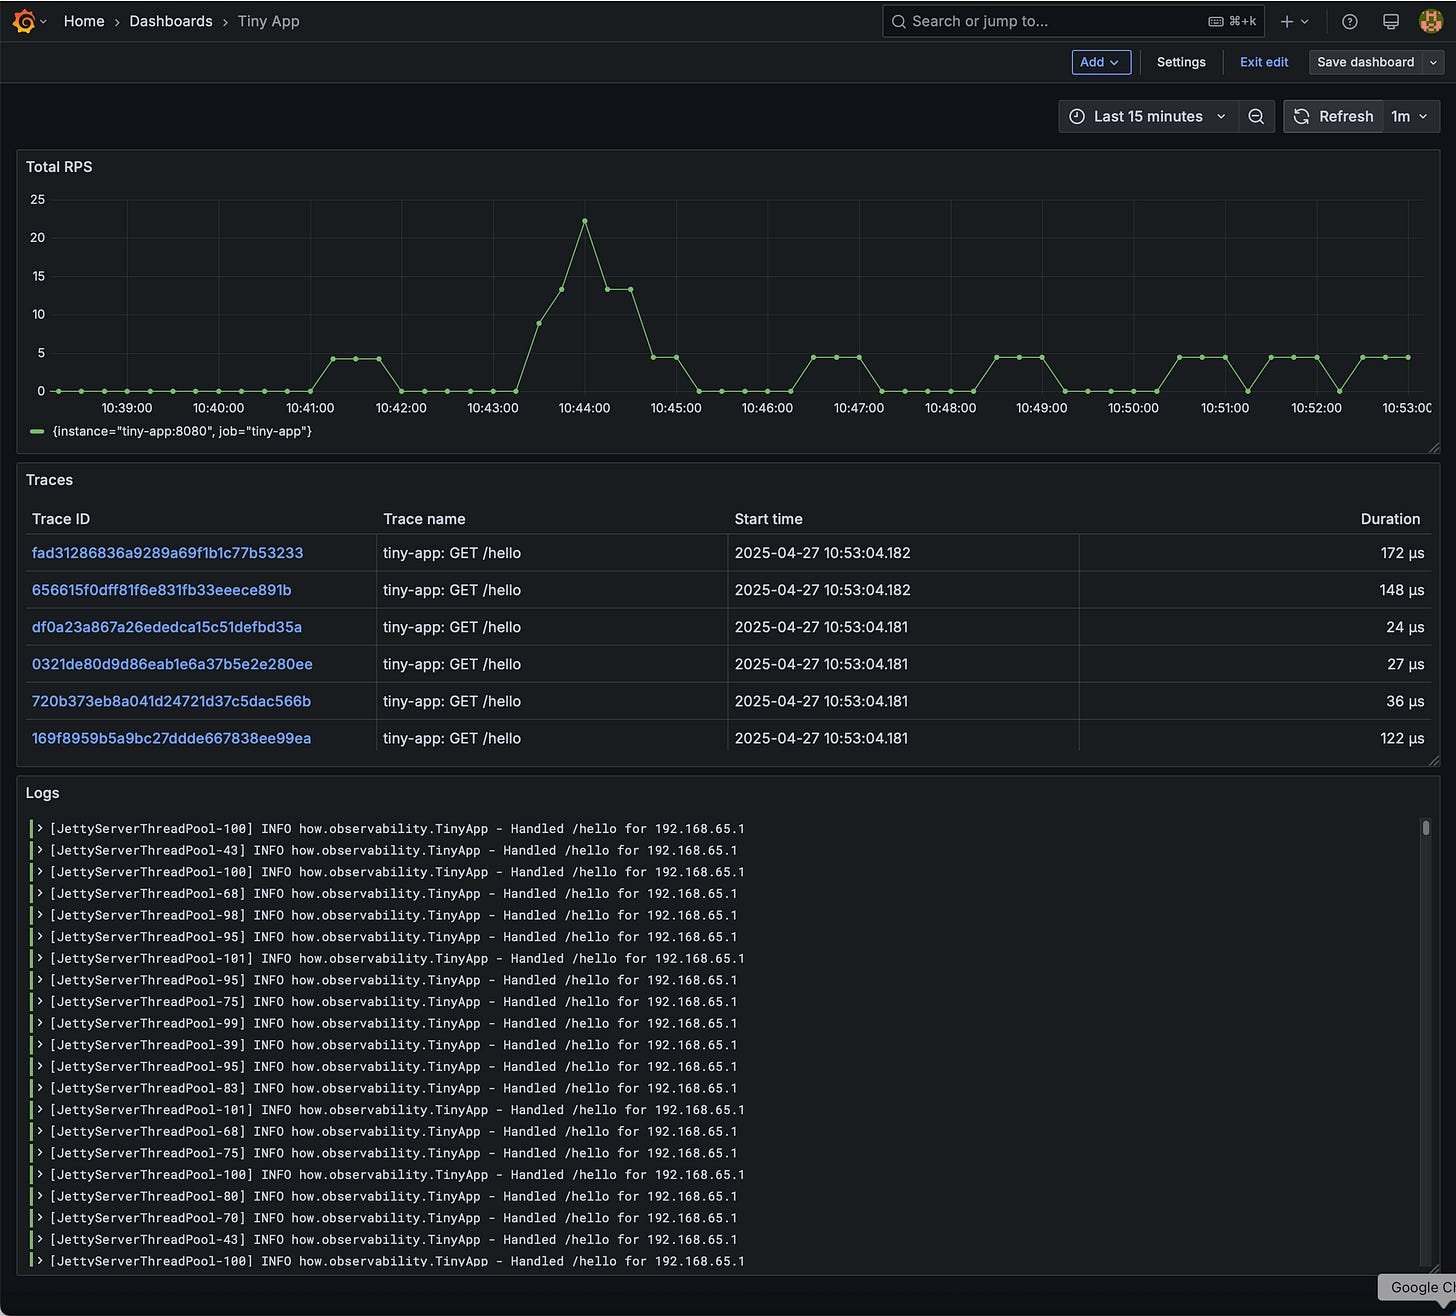
6.2 Quick Dashboards
Metrics panel: Choose the Prometheus data source with below query.
rate(tiny_hits_total[1m])
Logs panel: Choose the Loki data source with below query.
{service_name="tiny-observability-stack-tiny-app-1"}Traces panel: Choose the Jaeger data source and click “Search” pick tiny-app.
6.3 Alert in Action
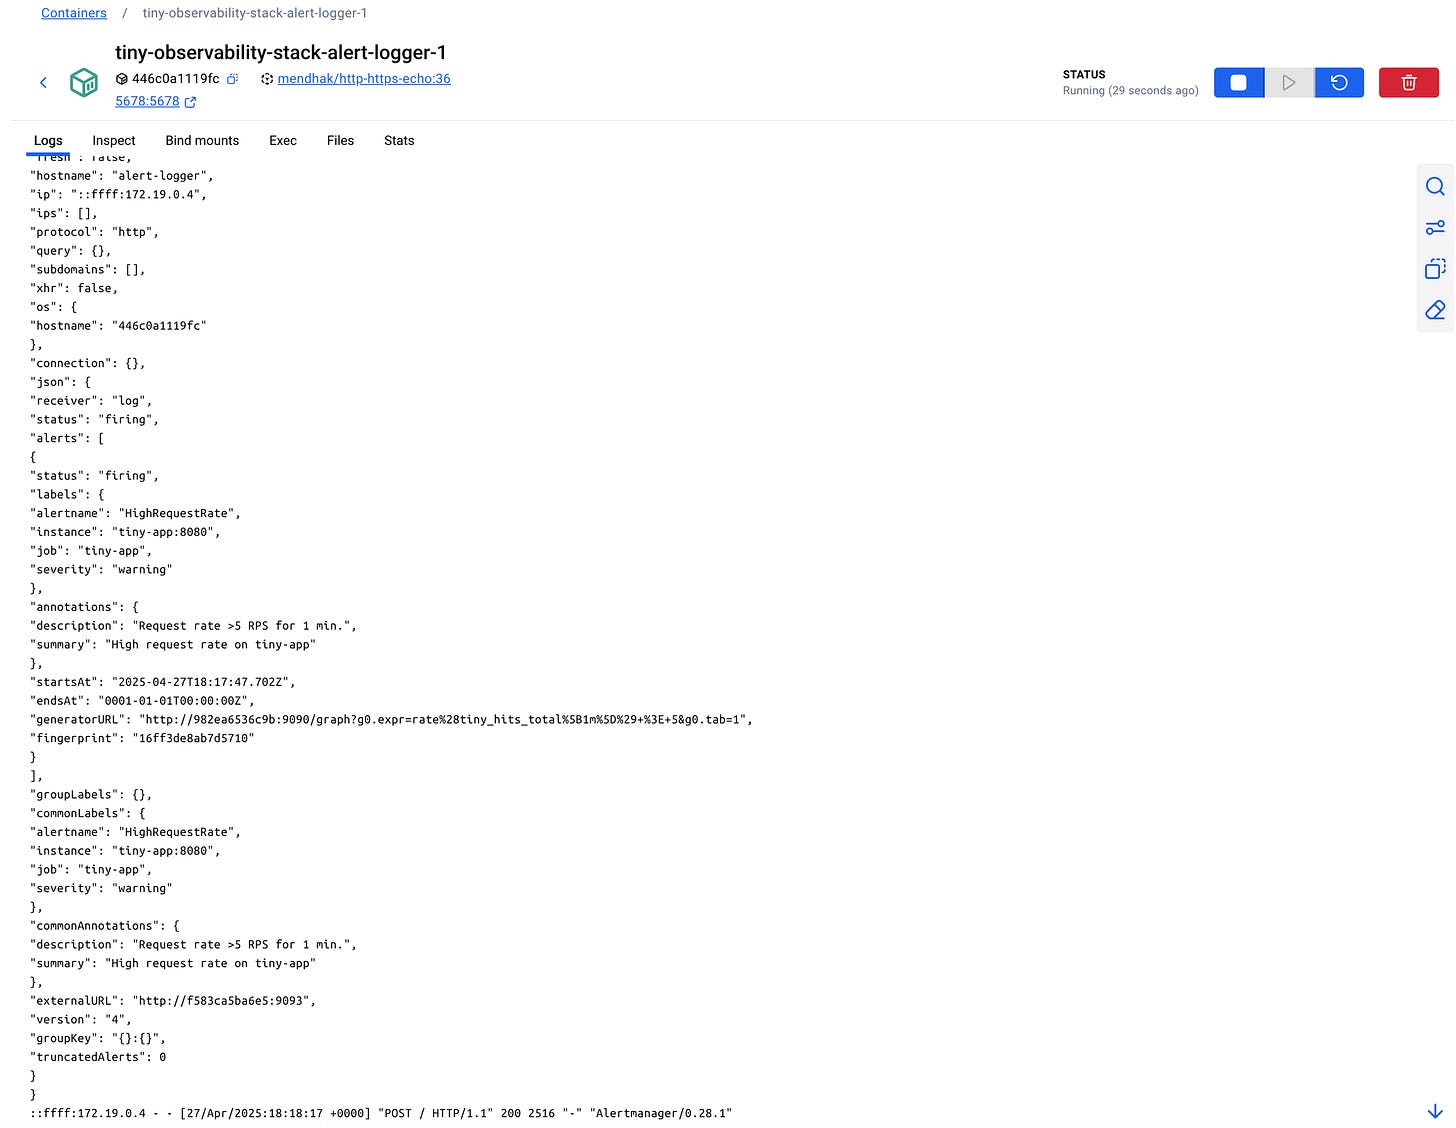
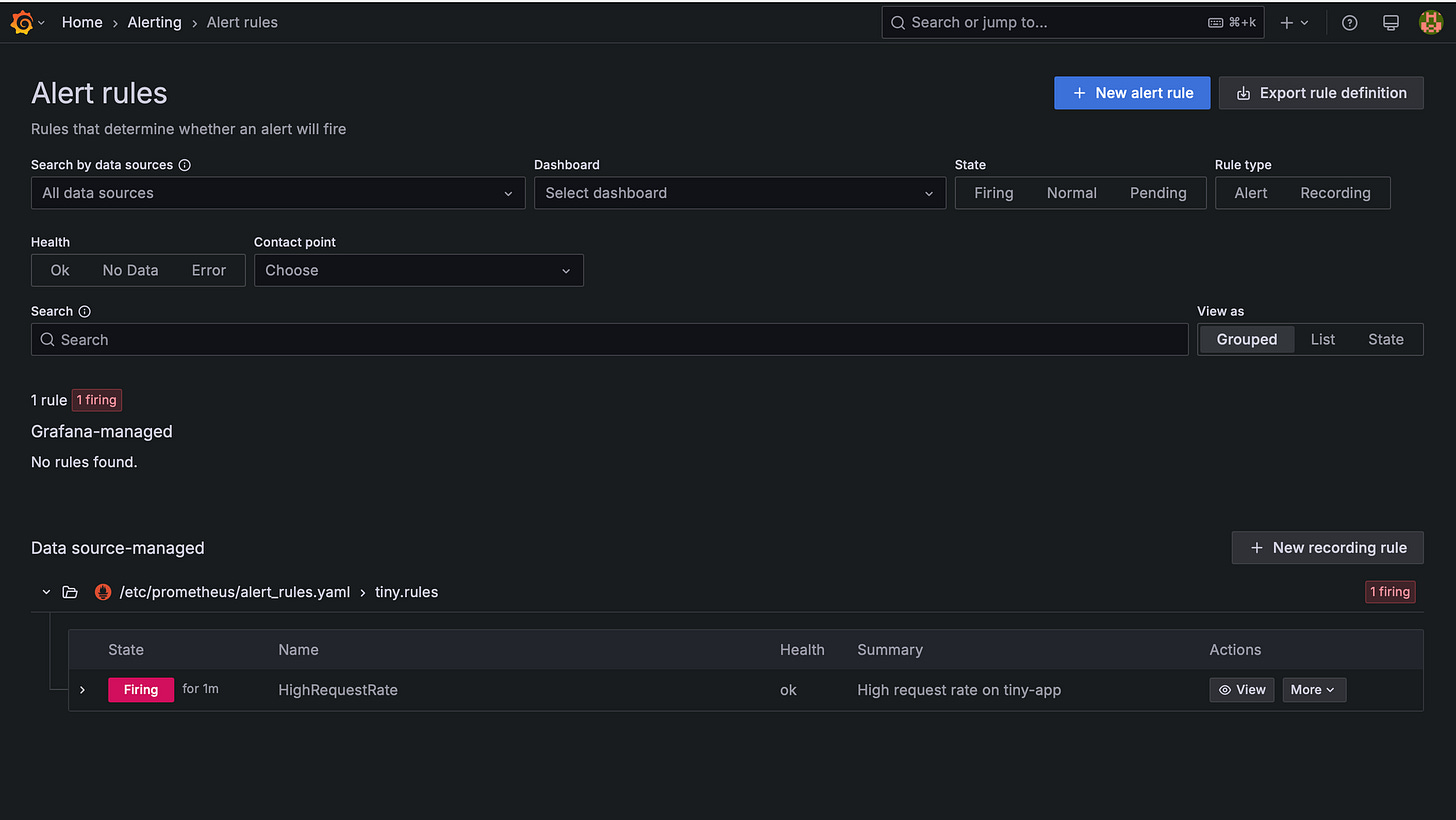
Keep hammering /hello (e.g., ab above). When rate(demo_hits_total) exceeds 5 RPS for > 1 minute, Prometheus fires HighRequestRate. Check:
docker compose logs alert-logger
You should see a POST with JSON alert payload 👏.
Grafana also lists it under Alerting → Alert rules. (Feel free to wire Alertmanager to Slack/email later.)
7 – Under the Hood: What Just Happened?
OpenTelemetry Java agent auto‑instrumented Javalin, captured HTTP spans, and exported via OTLP → Jaeger.
Micrometer registers
/metrics, Prometheus pulls every 15 s.Promtail tails container stdout, ships to Loki.
Grafana unifies everything, and Prometheus Alertmanager paged us.
8 – Where to Go from Here
Next Step | Why it’s Cool | Link
Create a service map in Grafana with Tempo traces | See cross‑service flow | Tempo docs
Add Prometheus remote‑write to a cloud TSDB for long‑term storage | Keep metrics for >30 days | Prometheus docs
Enable Loki ruler for log‑based alerts | Catch error patterns | Loki alerts
Try Grafana k6 to load‑test and visualize in same stack | Unified perf testing | k6 docs
Swap Docker for Kubernetes | Closer to prod reality | e.g. kube-prometheus-stack
9 – Wrap‑Up
You just:
Built a tiny Java service
Containerized it with auto‑instrumentation
Launched Prometheus + Alertmanager, Loki + Promtail, Jaeger, and Grafana in one shot
Watched live metrics, logs, traces, and an alert—all open source, no credit card, ~200 lines of YAML.
Pat yourself on the back 👏. From here, you can iterate: add more apps, define SLOs, integrate CI/CD. Remember: observability isn’t a destination; it’s a practice. But now you’ve got a solid starter toolbox—happy hacking!
Source code: https://github.com/ObservabilityHow/tiny-observability-stack


