Observability for LLMs: Why It Matters and How to Achieve It
Large Language Models (LLMs) like GPT-4 and Llama are powering a new wave of applications – from chatbots and coding assistants to search engines and enterprise analytics. However, deploying these LLM-driven applications in production is not a set-and-forget task. LLMs are massive, complex, and often unpredictable systems. Ensuring they perform well, remain reliable, and behave as expected requires robust observability. In this post, we’ll explore why observability is essential for LLM applications, how to achieve it with the right tools and best practices and a simple demo to get you started!
Why Observability is Essential for LLM Applications
Running LLMs in production presents unique challenges compared to traditional software or even classic ML models. These models are non-deterministic, resource-intensive, and behave like black boxes, so you often can’t predict or easily debug their outputs. Observability is crucial in this context because it lets you monitor and understand the system through its outputs and metrics, catching issues early and ensuring a good user experience. Here are some key reasons LLM observability is vital:
Performance and Reliability: Users expect responsive, reliable AI services. Monitoring metrics like inference latency, throughput, and error rates ensures the LLM meets performance SLAs. For example, if latency spikes or the model stops responding, observability alerts you immediately to investigate. High uptime (e.g. 99.95% availability) is often needed in production – you can’t achieve that without visibility into system health. Continuous tracking of these metrics lets teams detect degradations and compare against benchmarks to catch regressions early.
Quality and Hallucination Detection: LLMs sometimes produce incorrect or fabricated answers (“hallucinations”), or otherwise unsatisfactory outputs. Without observability, these bad outputs might go unnoticed until users report them. By logging and reviewing LLM responses, or by implementing automated checks, teams can catch when the model’s output is factually wrong, incoherent, or toxic. Observability helps identify patterns of failure – for instance, if certain prompts consistently lead to nonsense answers or if the model’s accuracy drifts over time. This is critical for maintaining user trust.
Understanding User Interactions: Observability isn’t only about the model – it’s also about the user experience. By recording user prompts, queries, and how the LLM responds, product teams can gain insight into how people are actually using the application. This data reveals user needs, common failure scenarios, and opportunities for improvement. For example, prompt logs might show that users frequently ask questions outside the model’s knowledge scope – information that could inform better prompt design or model updates. Tracking user feedback (like thumbs-up/down ratings on responses) further closes the loop, highlighting where the LLM is meeting expectations and where it’s not.
Security and Trust: LLM applications face novel failure modes and security risks. Prompt injections (where a user’s input tricks the model into ignoring its instructions or producing disallowed content) are a real threat. An observability layer can detect anomalous inputs or outputs that indicate such attacks or misuse. Similarly, monitoring can catch when the model outputs sensitive data or biased content, which is crucial for maintaining ethical standards and user trust. For industries under compliance requirements, detailed logs of model decisions and interactions are indispensable – they provide an audit trail to explain the AI’s behavior to regulators or to internal risk teams.
Cost and Resource Management: Large language models are resource-hungry and, if using third-party APIs, can rack up substantial token costs. Observability enables you to keep an eye on token usage, CPU/GPU utilization, and memory in real time. By tracking these, teams can optimize infrastructure and usage patterns to control costs. For instance, you might discover that a particular prompt or user workflow is consuming an unusually high number of tokens or causing excessive load – a signal to optimize the prompt or scale hardware accordingly. Observability tools help attribute usage and cost to specific features or user segments via tagging, so business owners (e.g. a CTO or product manager) can understand ROI and ensure the LLM’s operating cost stays within budget.
Without strong observability, you risk flying blind with your LLM in production. Monitoring and logging are the safety net that catches model hallucinations, latency spikes, security incidents, and other issues before they spiral into user-facing problems. They also provide the data to continuously improve the system. Next, let's discuss how to actually achieve this observability in practice.
Achieving Observability for LLMs: Tools and Best Practices
Implementing observability for an LLM system means capturing data at multiple levels of the application. Best practices are still emerging, but several key techniques and tools have proven valuable:
Logging Prompts and Outputs (Prompt Analytics): A fundamental step is to log every prompt and the model’s response, along with relevant metadata. This includes the raw user query or input, any prompt templates or chain-of-thought used, the model’s outputs, and metadata like timestamps, model version, or prompt ID. Structured logging of prompts and responses is invaluable – it lets you later search and filter interactions to debug issues or analyze trends. For example, you can query logs to find all instances where the model answered “I don’t know” or produced an error, then examine what prompts caused it. Prompt analytics involves aggregating this log data to answer questions like: Which prompts are most common? What categories of user questions lead to the longest responses or highest error rate? By tracking prompt usage and outcomes, you can refine your prompt templates and A/B test prompt variations to see which yield better answers or lower latency. User feedback should also be logged and tied to the corresponding prompts/responses – even simple thumbs-up/down signals can highlight problematic outputs and guide prompt or model improvements.
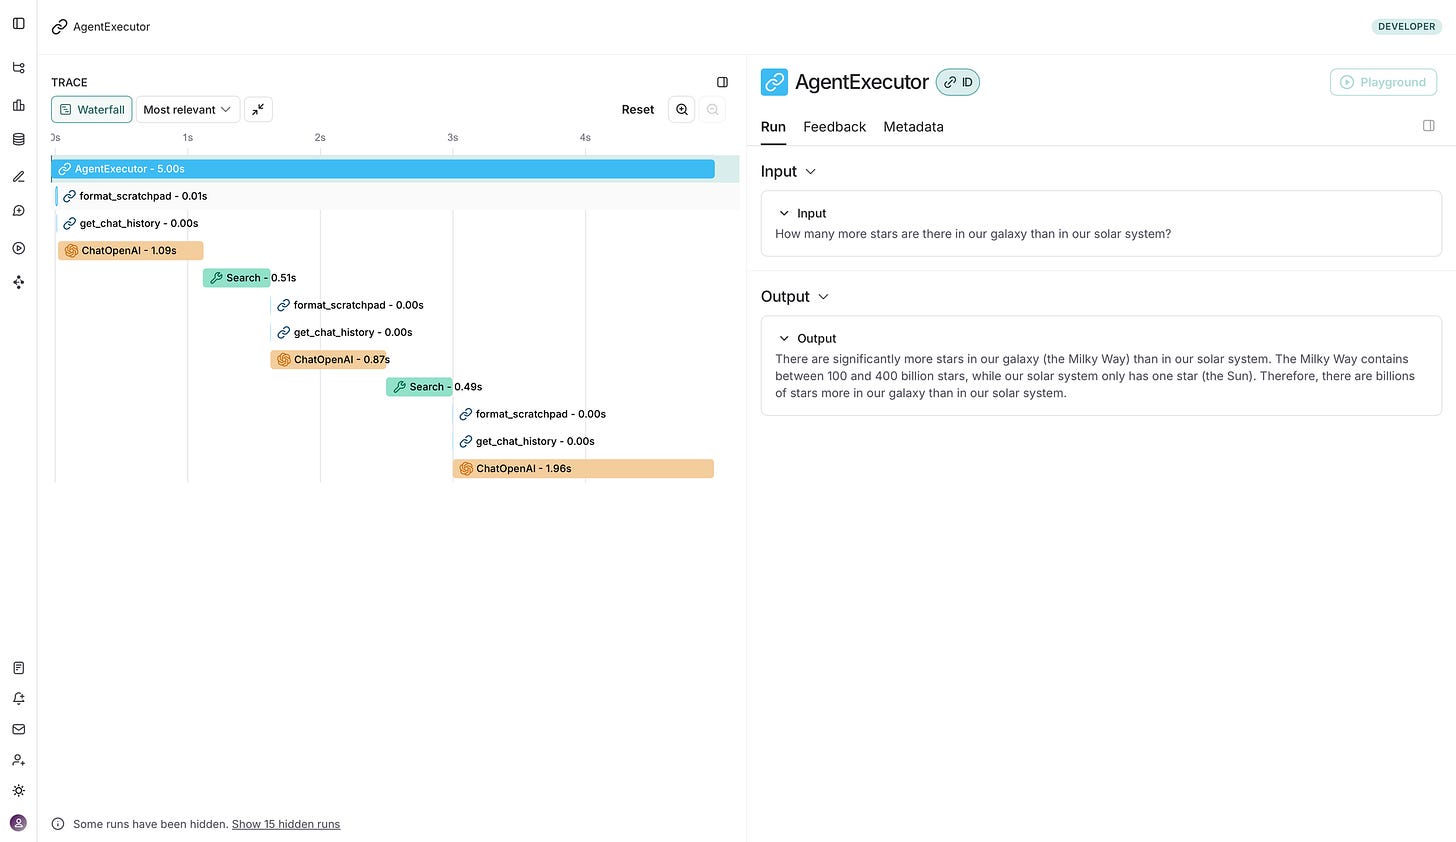
End-to-End Tracing of LLM Workflows: Logging alone may not show how a request flows through a complex LLM application, especially if your app involves multiple steps (retrieval, calling external APIs or tools, chaining multiple model calls, etc.). Distributed tracing is the practice of capturing a single transaction’s path through the system. In an LLM app, a trace might start when a user question arrives, include a vector database retrieval step, then the LLM generation step, and finally any post-processing before a response is returned. Each step is recorded as a span with timing and metadata. Tracing is crucial for debugging multi-component chains: it helps isolate where bottlenecks occur (e.g. a slow database lookup or an LLM call waiting on an external API), and why a chain might be failing or looping. Modern LLM frameworks like LangChain and LlamaIndex support tracing of their chains, and there are standards like OpenTelemetry (with initiatives such as OpenLLMetry/OpenLIT) to standardize LLM tracing across tools. Setting up tracing typically involves instrumenting your code or using middleware that records spans automatically. The result is a rich trace that can be visualized for each user query.

Monitoring Performance Metrics: In addition to logs and traces, you should collect quantitative metrics on the LLM’s performance and resource usage. Common metrics include latency (how long each request or each step takes), throughput (requests processed per second), token usage per request (input and output tokens, which often correlates with latency and cost), and error rates (how often the model fails to return a result or triggers an exception). Resource metrics like CPU/GPU utilization, memory usage, and GPU VRAM are also important to ensure your infrastructure isn’t becoming a bottleneck. Observability systems (whether custom or via existing APM tools) should be set up to track these over time and trigger alerts on abnormal spikes. For example, you might set an alert if the 95th percentile latency exceeds a threshold, or if token usage per response suddenly doubles (which could indicate the model is rambling or not grounding answers properly). Monitoring these metrics in real time allows for proactive scaling decisions and performance tuning.
Automated Evaluation and Drift Detection: One of the hardest parts of LLM observability is measuring output quality, because for many queries there’s no single correct answer. Nonetheless, it’s important to track proxies for quality and detect when the model’s responses start to deteriorate or deviate from desired behavior. This can be done via LLM evaluations – automatically scoring or classifying model outputs on certain criteria. Some approaches include using a separate AI judge model to rate responses for correctness/relevance, comparing answers to a set of curated reference answers, or logging user ratings as a direct quality signal. For instance, you might periodically feed the model a set of test questions (with known good answers or using an AI evaluator) to compute an accuracy or coherence score over time. A drop in these scores would flag a potential model drift issue. Drift detection is crucial: over time, the distribution of user queries may shift, or if you’re pulling a model from an API, the provider might update it behind the scenes, causing behavior changes. If an LLM that once answered correctly is now frequently wrong on the same kind of question, that’s a red flag. To catch these issues, implement regular checks such as: track the percentage of “good” vs “bad” responses per day (using whatever quality metric you define), monitor the distribution of response lengths or languages (since abnormal lengths or gibberish might indicate a problem), and examine whether new user inputs are falling outside the model’s previously seen domain. The goal is to surface quality issues early so you can retrain models, adjust prompts, or roll out fixes before users churn.
Retrieval & External Data Monitoring: A large portion of LLM applications today use Retrieval-Augmented Generation (RAG) or other external tools to ground the model with up-to-date or domain-specific information. In these systems, observability needs to extend to those external components as well. If your LLM fetches context from a vector database or calls a web API, you should monitor the quality and timing of those operations. For example, track the relevance of retrieved documents (perhaps by logging retrieval scores or performing a secondary check on whether the answer actually used the docs), and track failures or timeouts in the retrieval process. An observability solution might let you trace and analyze retrieval steps similarly to LLM calls. This is important because if retrieval fails silently or returns irrelevant data, the model’s output will suffer even though the model itself is fine. By analyzing this, you might decide to tweak your vector index, improve the embedding model, or adjust your retrieval strategy.
Using the Right Tools and Platforms: Achieving all of the above can be complex, but fortunately a number of tools have emerged to help. Many teams start with a combination of existing observability tools (like logging platforms or APM dashboards) and some custom scripts, but there are now purpose-built LLM Observability platforms. For example, open-source libraries like Arize Phoenix or LangChain’s LangSmith SDK can instrument your LLM app to automatically capture prompts, traces, token counts, and even run evaluations. Other tools like Langfuse and Helicone provide hosted solutions to log and visualize LLM usage with minimal integration effort. These platforms often offer UIs to explore traces, prompt management interfaces, and analytics specifically designed for LLM use cases. When implementing LLM observability, it’s a good practice to leverage such frameworks and standards (e.g. use OpenTelemetry for traces, use existing SDKs for your LLM framework) rather than reinventing the wheel. The field is evolving quickly, and tools will continue to adapt as new best practices emerge.
Demo: LangChain + OpenTelemetry
Let's look at a demo example of instrumenting traces in your LLM application:
1 – Configure your environment
export LANGSMITH_OTEL_ENABLED=true
export LANGSMITH_TRACING=true
# This example uses OpenAI, but you can use any LLM provider of choice
export OPENAI_API_KEY=<your-openai-api-key>
2 – Trace LangChain workflow with OpenTelemetry
"""Minimal example that traces a LangChain workflow with OpenTelemetry."""
from langchain.chains import LLMChain
from langchain.prompts import PromptTemplate
from langchain_openai import ChatOpenAI
from opentelemetry import trace
from opentelemetry.exporter.otlp.proto.http.trace_exporter import OTLPSpanExporter
from opentelemetry.sdk.resources import Resource
from opentelemetry.sdk.trace import TracerProvider
from opentelemetry.sdk.trace.export import BatchSpanProcessor

# 1️⃣  Configure OpenTelemetry
resource = Resource.create({"service.name": "llm-demo"})
provider = TracerProvider(resource=resource)
provider.add_span_processor(
    BatchSpanProcessor(OTLPSpanExporter())
)
trace.set_tracer_provider(provider)
tracer = trace.get_tracer(__name__)

# 2️⃣  Build a LangChain
llm = ChatOpenAI(model="gpt-4o-mini")
prompt = PromptTemplate.from_template("Translate to French:\n\n{input}")
chain = prompt | llm

# 3️⃣  Invoke within a parent span for full end‑to‑end context
with tracer.start_as_current_span("user_translate_request") as span:
    result = chain.invoke({"input": "Hello, how are you?"})
    print(result)
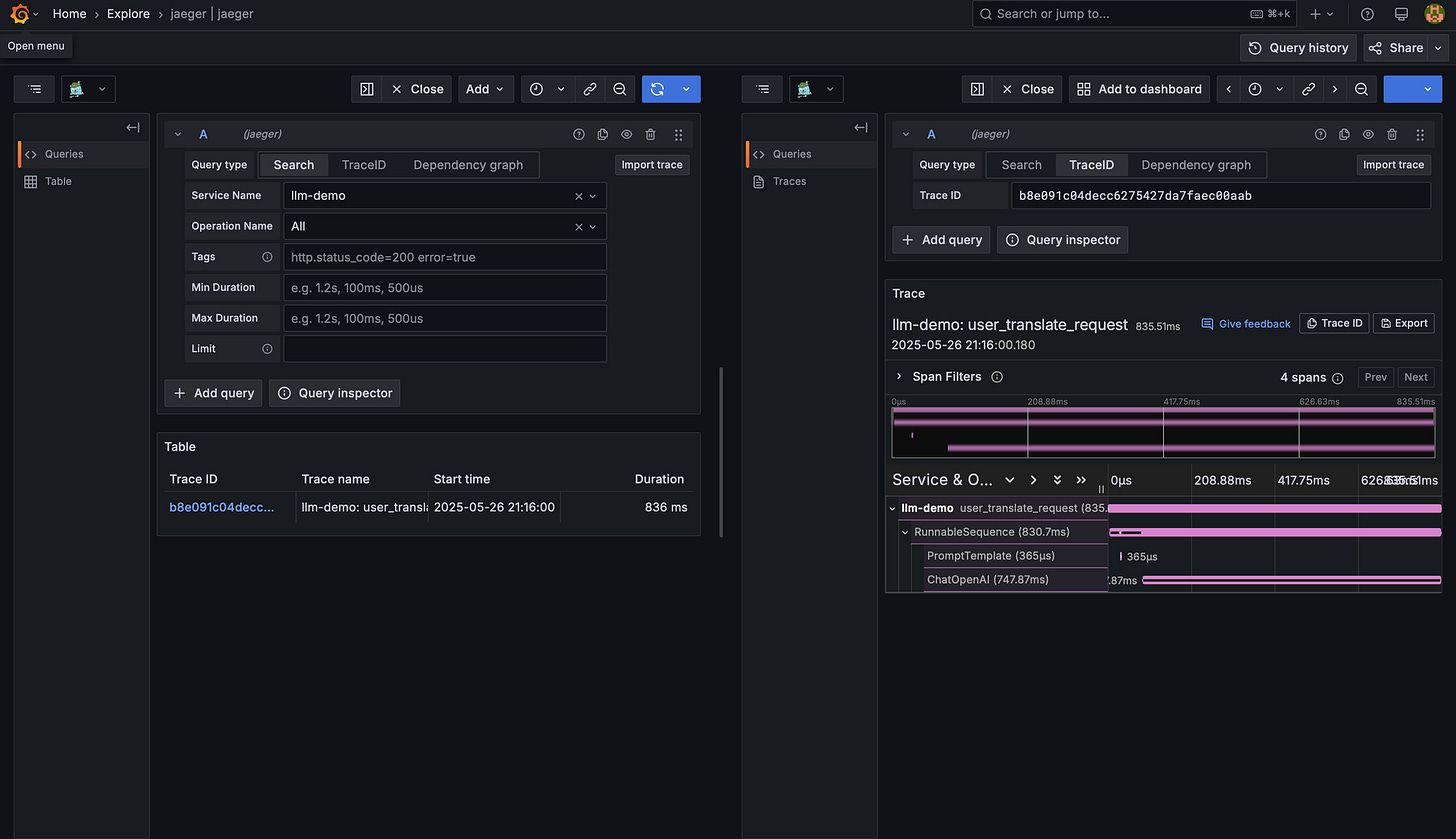
3 – View your Trace
Make observability a first-class concern when building LLM applications. Instrument early and extensively – it will save you countless hours of debugging and help ensure your application delivers consistent value to users. As LLM technology and usage evolve, so will observability practices. The organizations that succeed with AI will be those that treat observability as an integral part of their LLM deployment strategy, giving them the confidence to scale these powerful models responsibly and effectively. Happy Prompting!


