Scaling Observability: Designing a High-Volume Telemetry Pipeline - Part 1

Building observability in large-scale, cloud-native systems requires collecting telemetry data (metrics, traces, and logs) at extremely high volumes. Modern platforms like Kubernetes can generate millions of metrics, traces, and log events per second, and enterprises often must handle this flood of telemetry across hybrid environments (on-premises and cloud). Designing a telemetry pipeline that scales to these volumes is challenging but essential for reliable monitoring and troubleshooting. This 4-part blog series dives deep into how senior engineers and architects can design a high-volume observability pipeline. We’ll explore each telemetry signal type, discuss architectural patterns for scaling them, and examine techniques used in production at large organizations – from trace sampling strategies to metrics aggregation and remote storage to log sharding and retention. We’ll also cover the ingestion layer (collectors, agents, Kafka), real-time stream processing for enrichment, buffering and backpressure, horizontal scaling approaches, cost-control measures, and lessons learned (including trade-offs and anti-patterns to avoid).
The goal is to provide a practical guide to scaling observability pipelines to millions of events per second – without breaking the bank or losing critical visibility.
Telemetry Signals at Scale
High-volume observability pipelines must ingest and process three primary telemetry signals, often called the “three pillars” of observability: metrics, traces, and logs.

Each signal has distinct characteristics and scaling challenges:
- Metrics – Numeric time-series data (e.g. CPU usage, request count) sampled at intervals. Metrics are high-frequency and used for monitoring trends and alerting. At scale, metrics may involve millions of distinct time-series (unique combinations of metric name and labels) and extremely high ingestion rates. The challenge is handling high write throughput and queries across massive time-series datasets while controlling cardinality.
- Traces – Distributed traces follow a single request as it propagates through microservices, consisting of many timestamped spans. Traces provide detailed, per-request insight but storing every trace is typically infeasible at scale. High-volume systems may produce millions of spans per second, requiring careful sampling and efficient storage (e.g. indexing only certain fields). The challenge is capturing enough traces to be useful (especially error traces) while dropping or summarizing the rest to limit overhead.
- Logs – Immutable, text-based event records. Logs contain rich detail (error messages, stack traces, etc.) but are produced in huge volumes, especially in verbose or debug modes. Large organizations might ingest terabytes of log data per day, which strains storage and indexing systems. The key challenge is ingesting and indexing logs efficiently (or using alternative approaches to full indexing) and managing retention/cost, since logs can accumulate quickly.
In cloud-native, containerized environments, telemetry data is highly dynamic and distributed. Kubernetes spin up and down containers, causing metric series churn and high log volumes from short-lived pods. A pipeline must handle ephemeral sources and multi-tenant data (e.g. multiple teams or services) without losing data or context. In hybrid environments, the pipeline should aggregate data from on-premises datacenters and multiple clouds, providing a unified view.
Key scaling challenges across these signals include throughput (events per second), data volume (storage and retention), data correlation (linking traces with logs/metrics), and system bottlenecks (ensuring one hot service’s telemetry doesn’t overwhelm the pipeline). We’ll address these by examining specialized strategies for each signal type and general architectural patterns for high-volume pipelines.
High-Level Pipeline Architecture and Design Principles
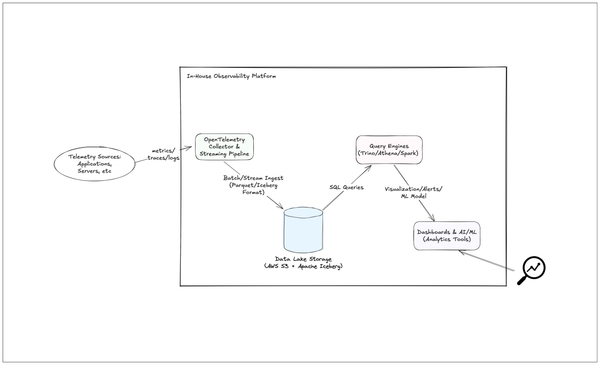
Let’s outline the overall architecture of a scalable observability pipeline. At a high level, such a pipeline consists of several stages:
1 – Data Collection (Ingestion): Telemetry is generated by applications, infrastructure, and services. It’s collected by agents or libraries (e.g. instrumentation SDKs for traces, exporters for metrics, log forwarders) and sent into the pipeline. In a robust design, a unified collector can receive all three signals, or specialized collectors handle each. The goal is to reliably get data off of sources (pods, VMs, devices) and into a processing system without overwhelming the sources.

2 – Data Processing and Buffering: Once inside the pipeline, telemetry may be filtered, aggregated, sampled, or enriched. This stage often involves stream processors or intermediate buffers. Examples: an OpenTelemetry Collector applying sampling or adding metadata to traces; a streaming job (Apache Flink/Spark) performing real-time analytics on logs; a Kafka cluster buffering bursts of log events. Processing nodes should be stateless or partitioned for horizontal scaling, and buffering is used to absorb spikes and decouple producers from consumers.
3 – Storage and Indexing: After processing, telemetry is routed to storage backends optimized for each data type: a time-series database for metrics, a trace store for distributed traces, and a log indexing system or data lake for logs. These backends must be distributed and scalable to handle continuous high write rates and support queries. Examples include Mimir for metrics, Jaeger-supported backends or Tempo for traces, and Elasticsearch/OpenSearch, or ClickHouse/Loki for logs. Data may be stored with replication for high availability and possibly tiered (hot vs cold).
4 – Query and Visualization: The end-users (developers, SREs, analysts) query this telemetry via tools like Grafana dashboards (for metrics), trace viewers, or log search interfaces. While this is outside the ingestion pipeline itself, the pipeline’s design heavily influences query performance. (We’ll focus on the pipeline internals rather than UI, but it’s important to ensure the pipeline delivers data in a query-friendly form).
Crucial design principles for scaling at each stage include horizontal scaling, stateless processing, and backpressure management. Horizontal scaling means any component (collectors, queue brokers, storage nodes) can be scaled out (add more instances) to increase capacity, with work partitioned among them. This typically requires stateless workers or consistent hashing of data (so, for example, all metrics for a given series go to the same shard). Stateless or loosely stateful processing makes rolling upgrades and scaling easier. Backpressure management means if any consumer lags (e.g. the database is slow to ingest), the pipeline can buffer data or throttle input rather than crash or lose data unexpectedly.
The pipeline architecture should accommodate different collection methods while maintaining a decoupled, scalable core with common infrastructure like message queues or processing frameworks to handle the load.

With the high-level picture in mind, let’s break down how to scale each telemetry signal type in Part 2. Happy Scaling!


