Scaling Observability: Designing a High-Volume Telemetry Pipeline - Part 2
In the Part 1, we saw that a scalable pipeline architecture consists of data collection, processing, storage, and querying stages, with key design principles including horizontal scaling, stateless processing, and backpressure management. Now, let's examine specialized scaling strategies for each telemetry signal type.
Scaling Metrics Pipelines
Metrics are the bread-and-butter of monitoring, and at scale they present unique challenges. A single Kubernetes cluster can easily produce millions of metric samples per second (from container stats, application metrics, etc.), and enterprises often want to retain metrics for long periods (months or years) for trend analysis. The two big issues are throughput (ingesting and storing the metric samples) and cardinality (the number of unique time-series).
Collection
In cloud-native setups, metrics collection is often done via Prometheus-style scraping: each service or node exposes an HTTP endpoint with its metrics, and a Prometheus server (or multiple) scrapes these periodically (e.g. every 15s). At very high scale, a single Prometheus instance is insufficient – it has a limit on samples per second it can scrape and store before performance degrades. Solutions include sharding the scrape load across multiple Prometheus servers or using an agent like the OpenTelemetry Collector to push metrics. Many large deployments switch to a “pull into push” model: Prometheus scrapes locally and then remote-writes the data to a scalable backend. The backend, such as Grafana Mimir or Cortex, is a distributed time-series database that can handle far more data than a single Prometheus instance.
Distributed Metric Storage
Cortex and its successor Grafana Mimir were designed to make Prometheus horizontally scalable and multi-tenant. They break the work into microservices (often called distributors, ingesters, queriers, etc.). For example, Grafana Mimir’s architecture has a write path where incoming metric samples are routed by a distributor to a set of ingesters, which buffer and batch data into storage. Each ingester handles a subset of series (using hashing to divide series among ingesters) and writes data in efficient chunks. Data is replicated for reliability – by default, each time-series is replicated to three ingesters. The ingesters periodically flush data to long-term storage (such as an object store like S3, storing data in blocks, often using TSDB format). A compactor service later deduplicates and compacts these blocks. On the read path, query frontend nodes split queries by time, cache results, and load-balance queries to querier nodes which retrieve data from both ingesters (for recent in-memory data) and long-term storage via store-gateway nodes.
The result is a system where you can linearly scale metric ingestion by adding more ingesters (and CPU/memory) and scale query capacity by adding more queriers. Grafana Mimir, for instance, has demonstrated the ability to scale to 1 billion active series and 50 million samples per second ingestion in benchmarking (using a huge cluster of 7000 CPU cores and 30+ TB RAM). While few need that extreme, this shows that with the right architecture, metric pipelines can push the limits of volume. Cortex/Mimir also enforce per-tenant limits to prevent any single team from overloading the system (e.g. cap number of series to avoid unbounded cardinality).
Other scalable metric systems exist as well: Thanos, which federates Prometheus servers by storing historical data in object storage and querying across instances, or VictoriaMetrics, a high-performance time-series database known for efficiency. Whether using these or a hosted solution (like AWS Managed Prometheus), the key strategies are similar: horizontally partition metrics and use distributed storage.
Aggregation and Downsampling
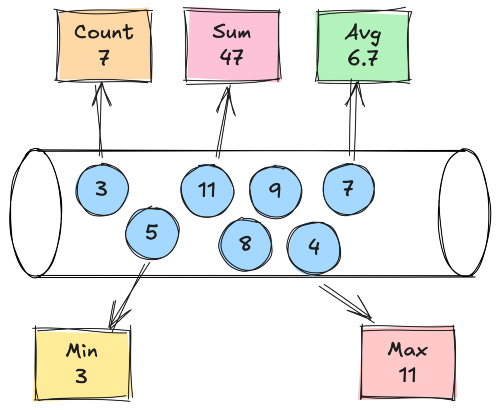
An important technique for metrics is pre-aggregation and downsampling. Not every raw metric needs to be stored at full resolution forever. Often, we aggregate at source – for example, an app might pre-compute count/minute or P90 latency to reduce the number of data points sent. Or the pipeline (via a collector or streaming job) might aggregate metrics from multiple instances (sum of all instances’ metrics) to reduce data points.
Additionally, after storing high-resolution data for a short period, older data can be downsampled (e.g. store 5-minute averages instead of 15-second data beyond 30 days). Systems like Mimir support recording rules or downsampling jobs to accomplish this. This significantly cuts storage needs while preserving long-term trends.
Metric Cardinality control
High-cardinality metrics (e.g. a metric labeled with userId or requestID) can blow up the number of time-series and choke the pipeline. Large organizations implement guidelines and sometimes automated checks to limit metric labels. Some metric backends allow dropping or relabeling metrics that exceed cardinality thresholds. At scale, you might also utilize hierarchical metrics (aggregating by service, not by individual IDs) and use exemplars or tracing for the per-ID detail instead.
In summary, a scalable metrics pipeline in a Kubernetes/hybrid environment might look like: an agent or sidecar on each node (Prometheus or OTel Collector) scraping local metrics, forwarding to a central metrics gateway (like a Cortex/Mimir distributor cluster) which writes to a distributed TSDB. The system is tuned to handle bursts (by batching samples), and you apply aggregation/sampling on metrics where possible. The metric store is configured for replication and long-term retention by offloading old data to cheap storage (e.g. S3). With this approach, companies can retain even millions of series of metrics cost-effectively. The trade-off is complexity: you now operate a complex distributed system for metrics, but it’s necessary once you outgrow a single-node Prometheus.
Scaling Traces Pipelines
Distributed tracing provides deep insights but is notorious for volume explosion. In a microservices architecture, a single user request might generate tens or hundreds of spans. Capturing every trace from every request at a large scale (say, thousands of requests per second) can overwhelm storage and network. Thus, sampling is a core strategy in high-volume tracing.
Trace Sampling Strategies
There are a few common sampling strategies in use:
Head-Based (Probabilistic) Sampling: Decide whether to sample a trace at the start of the trace (when the first span begins). This is usually a random probability (e.g. sample 1% of traces) or based on some simple criteria on the root span. Once the decision is made on the root span, that decision propagates to all spans in that trace (so you either keep the entire trace or drop it). Head-based sampling is simple and scalable – it’s implemented in the tracing SDKs, so unwanted traces are never even sent out by applications. It’s like judging a book by its cover: very fast but potentially “shallow”. The downside is you might drop interesting traces (e.g. ones with errors) just by random chance, since the decision can’t consider what hasn’t happened yet. However, head sampling has minimal overhead and works well with parallel collectors (no need to coordinate). Many organizations run with a low probabilistic sample rate globally (like 0.1% of requests) as a baseline.
Tail-Based Sampling: Decide whether to keep a trace after it has completed, i.e. after collecting all spans. This is like reading the entire book then deciding if it was interesting. Tail-based sampling allows much smarter decisions – for example, “keep all traces that had an error or a 5xx status code” or “keep 10% of traces for VIP customers and 1% of others”. You can implement rich policies: sample 100% of slow requests, or a higher rate for certain critical services, etc. The OpenTelemetry Collector’s tail-sampling processor supports rules on trace attributes, error flags, latency, and more. The trade-off is that tail sampling is resource-intensive: you must ingest all spans (at least buffering them) and then discard traces you don’t need. This puts overhead on the applications (they must emit every trace) and on the collectors/backends which have to hold a lot in memory. Implementing tail sampling in a distributed collector cluster requires careful design: typically a first layer of collectors does “span routing” to ensure all spans of a trace go to the same process (often using consistent hashing on trace ID), then a second layer actually applies the sampling decision. This two-layer approach adds complexity and network hops, and the buffering (usually spans are held for a few seconds) can strain memory. Therefore, many organizations only use tail sampling for specific high-value traces (like error traces) or in lower-volume environments.
Remote or Dynamic Sampling: A form of head-based sampling where the decision policy is centrally controlled and can change on the fly. Jaeger, for instance, supports remote sampling configurations – services poll a central config to get sampling rates per endpoint or operation. This allows adjusting sampling without redeploying apps; for example, during an incident you might temporarily increase sampling to get more traces for debugging. Remote sampling is essentially still head sampling (the app makes the call), but it’s “smart head sampling.” Many large deployments use this to manage sampling strategies centrally.
In practice, large-scale tracing pipelines often use a combination: heavy head-based probabilistic sampling to cut down volume (e.g. 90% of traces dropped), plus tail-based sampling in the collector to ensure certain categories are always kept (like error traces or extreme latency outliers). The combination yields a representative set of traces without overloading the system with every single request.
Ingestion and Transport for Traces
On the collection side, the common pattern is deploying OpenTelemetry SDKs in applications which export spans to a local agent (like an OpenTelemetry Collector or a Jaeger Agent as a sidecar/daemonset). The agent/collector batches spans and sends them to a central trace collector cluster. Using an agent on each host helps by batching and compressing data, and it can tag spans with metadata (like host name, cluster, etc.). The central collectors (which might be an OpenTelemetry Collector cluster or Jaeger collectors) then handle the data pipeline – possibly doing tail-sampling, transformations, and writing to storage. Because trace data can burst (a spike in traffic yields a spike in spans), organizations often buffer trace data in a message queue such as Kafka. In fact, Jaeger has optional support for using Kafka as the transport between agents and collectors (spans go into Kafka, and collectors consume from Kafka). Kafka decouples the ingestion from processing, providing durability and the ability to replay or handle spikes (more on Kafka in Part 3).
Trace Storage Backends
Storing traces efficiently is tricky. Traditional backends used by Jaeger and Zipkin include Cassandra or Elasticsearch for indexing spans. However, at cloud scale, these can be expensive and operationally complex. For instance, Elasticsearch can index trace data for rich search, but with large ES cluster the costs compound as you store more data, and are complex to manage. A newer approach exemplified by Grafana Tempo (and similar ideas in AWS X-Ray) is to avoid heavy indexing and instead store trace data as cheap as possible. Grafana Tempo is an open-source, high-volume tracing backend that allows 100% sampling by requiring only object storage (like S3 or GCS) as its database. Tempo does minimal indexing – typically just an ID to find a trace – which means it cannot query traces by arbitrary tags, only by trace ID or via external hints. This design allows Tempo to “hit massive scale without a difficult-to-manage Elasticsearch or Cassandra cluster”. In other words, you could ingest millions of spans/sec and store all of them cheaply, but you need another way to find interesting traces (such as linking from metrics or logs). Grafana uses exemplars – when a metric has an anomaly, an exemplar (a sample trace ID) is recorded – to jump from metrics to traces, thereby mitigating the need for full-text trace search.
Other organizations use a similar concept of splitting storage: e.g. store recent traces in a fast index (Elasticsearch) but archive older traces to cheap storage (like a data lake) without indexes. The choice often comes down to use case: Do you need to search traces by user ID or error message frequently (then you need indexing and will incur more cost)? Or is it sufficient to sample many traces and use metrics to point you to relevant ones? At extreme scale, many opt for the latter approach due to cost.
Additional Considerations
Key techniques include sharding by trace ID (so different collectors handle different sets of traces, ensuring all spans of a trace go to one shard) and scaling horizontally both the collectors and storage nodes. A challenge with horizontal scaling is maintaining ordering for tail sampling (the aforementioned need for routing spans). OpenTelemetry’s collector has a load-balancing exporter that can consistently hash traceIDs to collector instances. This allows adding more collector instances as needed to increase throughput, without mixing spans from one trace across them.
Additionally, the pipeline must avoid overwhelming apps. Tracing can add overhead in the application (serialization, network calls to send spans). Good practice is to make these non-blocking and low priority – e.g. use asynchronous exports and never slow down the business logic if the tracing pipeline is slow. If the pipeline backs up, the collector or SDK should start dropping spans rather than causing backpressure on the application threads (thus trading completeness for resiliency). This ties into backpressure management which we’ll discuss in Part 3.
In summary, a scalable tracing pipeline for millions of spans uses aggressive sampling up front, distributed collectors (often with Kafka in between), and a storage solution that is designed for high write throughput. It might store only sampled traces or use a two-tier approach (e.g. all traces for a short window, then downsampled for longer-term). Trace IDs are propagated everywhere (including in logs and metrics as labels) to allow correlation. The pipeline also often provides ways to get the “best of both worlds” – for example, head sample 1% of everything, but tail sample 100% of traces that are errors or have certain characteristics. That way, you drastically cut volume but still catch the important stuff. The trade-off here is that you might not have every single user’s trace, but you have enough data to diagnose issues, which is the point of observability after all.
Scaling Log Pipelines
Logs often account for the highest volume of telemetry data in large systems. Every application instance can emit multiple log lines per request or per second, leading to a firehose of unstructured data. Unlike metrics (which are numeric) or traces (which are structured spans), logs are semi-structured text and require indexing to query effectively (e.g. full-text search for error keywords). Scaling a log pipeline means handling huge ingest rates, indexing or storing efficiently, and managing retention.
Log Ingestion and Sharding
In Kubernetes, the de facto approach is using a node-level log agent (like Fluent Bit, Fluentd, or OpenTelemetry Collector) deployed as a DaemonSet. This agent tails the container runtime’s log files (or reads from stdout via logging driver) for all pods on the node. The agent labels each log line with metadata (pod name, namespace, etc.) and then forwards logs to a central system. Fluent Bit is a popular choice because it’s written in C with low memory overhead, capable of handling high log volumes with minimal CPU. Fluentd (in Ruby/C) is heavier but has a richer plugin ecosystem. The pipeline typically streams logs into a message queue or directly to a storage backend. A common pattern is Logs -> Fluent Bit -> Kafka -> [processing] -> storage. Kafka, again, is used as a buffer to decouple and handle burstiness.
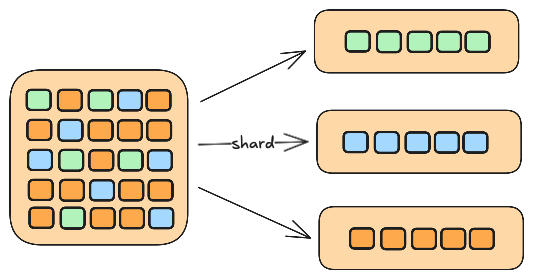
To scale ingestion, logs are usually partitioned by some key. If using Kafka, logs can be partitioned by an attribute (for example, by service name or by pod) ensuring the load is spread across Kafka brokers and across consumer instances later. If sending directly to an indexer like Elasticsearch, multiple ingest nodes can be behind a load balancer – each agent can hash or round-robin to different ingest endpoints. At very high rates, intermediate aggregators (Fluentd instances aggregating multiple Fluent Bit streams) might be introduced for hierarchical scaling.
Log Storage Solutions
The traditional solution is the ELK stack (Elasticsearch for storage/index, Logstash for processing (or Fluentd as an alternative), and Kibana for UI). Elasticsearch provides powerful full-text indexing and search on logs, which is incredibly useful (you can query on any field, do free-text search, aggregations, etc.). However, Elasticsearch can be expensive and challenging to scale to multi-terabyte/day log volumes. As logs grow, Elasticsearch clusters require many nodes, lots of IO and memory, and careful index management (sharding, replicas, index rotations). Many teams found that “free” ELK isn’t free at scale – “the underlying infrastructure of Elasticsearch is complex and costly, and those costs only compound as you scale and store more data”. As data grows, the cluster needs frequent tuning and may still suffer from long query times or high storage costs (since each log is stored along with its index, which can be 2-3x the raw data size).
Because of this, newer approaches have emerged:
Schemaless Log Databases (Loki): Grafana Loki is a horizontally-scalable, highly available log system designed to reduce cost by limiting indexing. Loki takes inspiration from Prometheus: it treats logs as time-series with labels. It indexes only the labels (metadata like source, service, pod, etc.) and not the full text of the log line. The actual log messages are stored in compressed chunks in object storage, much like metric data. This means queries in Loki typically require specifying labels to narrow down log streams (e.g. app=X, pod=Y) and optionally a text filter which will be applied by scanning the chunks. Loki’s minimal indexing yields huge cost savings: it uses minimal indexing, compressed storage, and LogQL for fast queries. Loki’s architecture is again microservices: distributors, ingesters, queriers, etc., similar to Cortex/Mimir. It’s designed to be scaled out easily and to store logs cheaply. The trade-off: you need to plan what labels to index (because if you need to search by something not indexed, queries devolve to brute-force scans). For many observability use cases (where you know the service/pod and time range you want to inspect), Loki works extremely well and at a fraction of the cost of full-text indexing. Loki essentially shifts the problem to “index metadata, but not message content” – you might not want to use it if you frequently search logs for arbitrary substrings without context.
Columnar Analytics Databases (ClickHouse): Some organizations repurpose big-data analytic databases for logs. ClickHouse, for example, is a columnar store that excels at aggregating large datasets. Logs can be structured (e.g. in JSON) and inserted into ClickHouse tables partitioned by date, service, etc. ClickHouse can compress data extremely well and uses column indexes (like skip indices and bloom filters) to speed up queries. It doesn’t automatically index every word like Elasticsearch, but if you structure your data, it can query certain fields very fast. In benchmarks, ClickHouse has shown much lower storage usage and faster aggregated queries compared to Elasticsearch. This makes it attractive for log analytics use cases where logs can be treated more like structured events (for example, counting errors, filtering by user ID, etc.). The downside is you may lose some of the flexible search capabilities unless you specifically index certain text fields.
Data Lake and Query-on-demand: For long-term retention at minimal cost, some pipelines send a copy of logs to cloud storage (S3, Hadoop, etc.) in compressed form (possibly in JSON or Parquet format) and use query engines like Amazon Athena, Apache Drill, or Trino to search them when needed. This is very cheap to store and only incurs cost or time when queries run. It’s not real-time (queries are slower), but for compliance or rarely accessed logs, this works well in tandem with a hot store. For instance, you might keep 7 days of logs in Elasticsearch for quick searches, but archive older logs to S3 and only query them via Athena when needed. This tiered storage approach is often used to keep costs manageable.
Index Sharding and Retention
If using a system like Elasticsearch/OpenSearch, careful sharding strategy is essential. Typically logs are indexed by time (daily indices), and you can shard by an entity (like service or customer) if needed to parallelize writes. Setting the right number of shards per index and using rollover indices (to keep shard sizes ideal) is necessary to avoid hot spots. Also, use Index Lifecycle Management (ILM): e.g. keep data in hot nodes for a few days, then move to warm nodes (cheaper storage), then cold, and eventually delete or snapshot. Many large ELK users have scripts or ILM policies to drop indices older than X days or move them to slower disks.
Pre-processing and Filtering
A huge factor in log pipeline scalability is filtering out noise before indexing. For example, you might drop debug logs in production or only sample logs from very chatty components. Tools like Fluent Bit/Fluentd allow rules to drop or route logs based on content or source. Some companies implement dynamic log sampling – if a particular log message is very repetitive (e.g. a certain warning spewing thousands of times), they sample it down. Edge computing or on-agent processing can convert logs to metrics (count occurrences of a log instead of sending every line) for certain cases. One approach is converting the bulk of logs into patterns or metrics to reduce volume, while still forwarding a subset of raw logs for deeper analysis. By reducing what goes into the expensive storage, you scale further.
In summary, a scalable log pipeline likely uses agents like Fluent Bit on each host, streams logs into a durable buffer (Kafka), and then has a consumer that indexes or stores logs. For indexing, one might run an Elasticsearch cluster with appropriate sharding and retention, but as scale grows, consider switching to or supplementing with Grafana Loki for cost efficiency or ClickHouse for high-performance queries on structured logs. Logs can also be tiered: e.g. recent logs in Loki (cheap and scalable, good for known queries), with a portion in Elastic for full-text search, and older logs archived. The pipeline must be tuned to avoid losing logs under peak load: use disk buffering in Fluentd/Fluent Bit (so if the network or Kafka is slow, logs spool to disk temporarily), and monitor pipeline health (e.g. monitor Kafka lag or Fluentd buffer fill level). Horizontal scaling is achieved by adding more consumers or more Kafka partitions, and by splitting logs by categories (for example, one pipeline for application logs, another for infrastructure logs, to isolate them).
The major trade-off in logs is query power vs cost: Full indexing (ELK) gives greatest query flexibility but can become prohibitively costly at scale; limited indexing (Loki) or no indexing (just store and grep) is far cheaper but needs more effort to find things. Many large orgs find a balance – e.g., index only error and warning logs fully, but store info/debug logs in cheaper form. Or index only certain fields. These nuances help scale practically.
In Part 3, we’ll discuss how you can assemble these scaled-up telemetry pipelines end to end—covering ingestion, stream processing, buffering/backpressure strategies, high availability, cost management, and key lessons learned in real-world deployments. Happy Pipelining!


